Introduction
Tulip is a SDK for the Java VM (JVM) to create load testing, stress testing, and performance regression testing benchmarks for software systems. Tulip is a robust solution for evaluating the performance and stability of web applications under varying conditions, ensuring they can handle high traffic and stress levels efficiently. Similar to well-known tools like JMeter, Gatling, and Locust, Tulip provides powerful capabilities to simulate real-world scenarios and generate comprehensive reports, helping developers identify and resolve potential bottlenecks.
Load-Test Driven Development
Tulip is designed to champion Load-Test Driven Development (LTDD). Too often software load testing is delayed until the final phases of a project. LTDD fundamentally shifts this focus by advocating for load testing in-the-small to begin as early as possible in the software creation life-cycle while at the same time still adhering to standard Test-Driven Development (TDD) best practices.
Tulip empowers software engineers to start load testing their code on day 1 of a project and not delay this important work until day N-10. See the following blog post for more information about Load-Test Driven Development:
Tulip Program Structure
A Tulip benchmark program consists of four parts:
-
Benchmark configuration file specifying benchmark scenarios to be tested
-
User class that implement actions to be benchmarked
-
App class that activates the Tulip runtime
-
Tulip runtime .jar file available from Maven Central

|
Languages
The Tulip runtime is written in Kotlin. Tulip benchmark programs (App and User classes) can be written in any Java Virtual Machine (JVM) programming language. The following languages are currently supported:
-
Java, Kotlin
-
Scala, Groovy
-
Jython
Workflows
A benchmark execution workflow is specified in Tulip as a Markov chain over a set of actions. Probabilities of moving from having performed one action to performing another action are specified in a JSON structure.
| Workflow Diagram | Specification |
|---|---|

|
|
In probability theory and statistics, a Markov chain or Markov process is a stochastic process describing a sequence of possible events in which the probability of each event depends only on the state attained in the previous event. Informally, this may be thought of as, "What happens next depends only on the state of affairs now.
Coordinated Omission
Tulip resolves the infamous Coordination Omission problem. It reports internal wait-time separately from external service-time. This is a reporting capability unique to Tulip. The internal wait-time statistics is used to tune the Tulip runtime environment by changing the number of worker threads, or changing the amount of heap space assigned to the Java VM, altering the throughput-rate, or adjusting worker thread input queue sizes; all in an attempt to reduce the internal wait-time to a reasonable level so that it has a negligible impact on end-user response times.
Coordinated Omission is the unintended back pressure a system under test can apply to a load generation tool that prevents that tool from accurately recording user experience. Response time = wait time + service time.
Reporting
HdrHistogram
Tulip uses HdrHistogram to display Latency by Percentile Distribution charts.
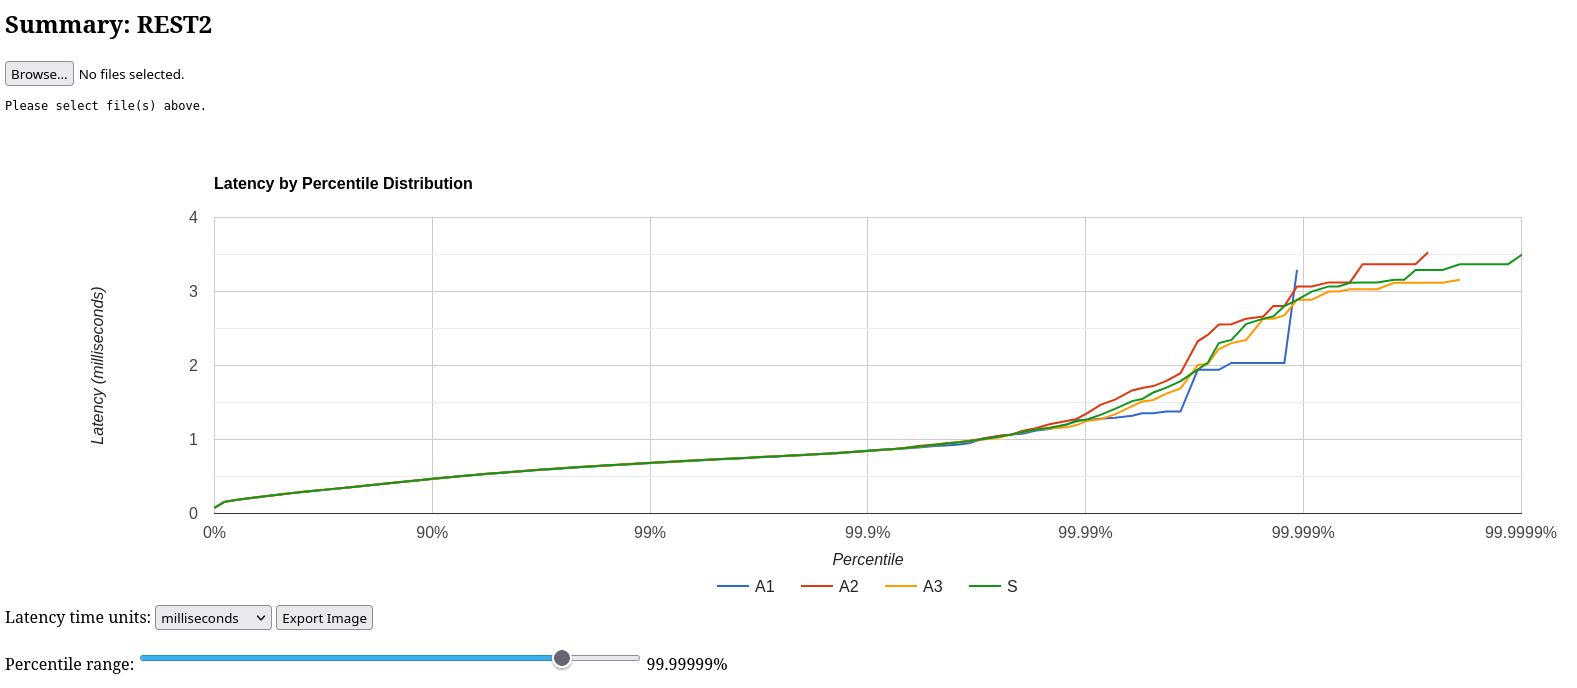
Figure 1. Percentile Distribution Chart
|
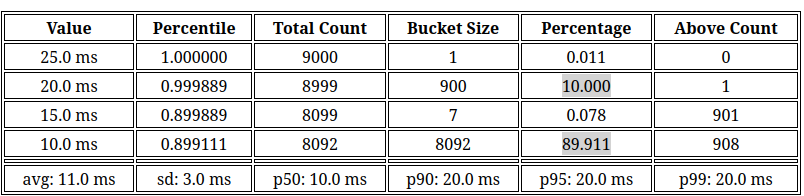
LlqHistogram
A Tulip-specific Log/Linear Quantized Histogram is used to provide a detailed view of the responses times of actions. In the example below the benchmark results of two actions with average response times of 10ms and 20ms are shown.
Apache eCharts
Apache ECharts are used to display the following charts.
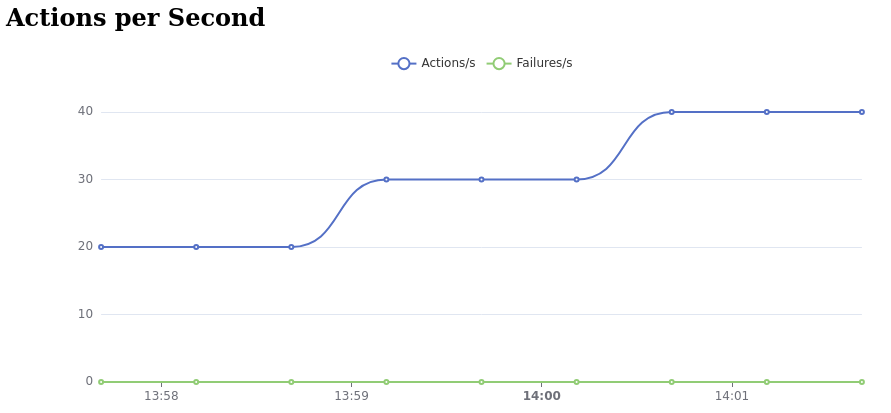
Figure 2. Global Throughput Chart
|
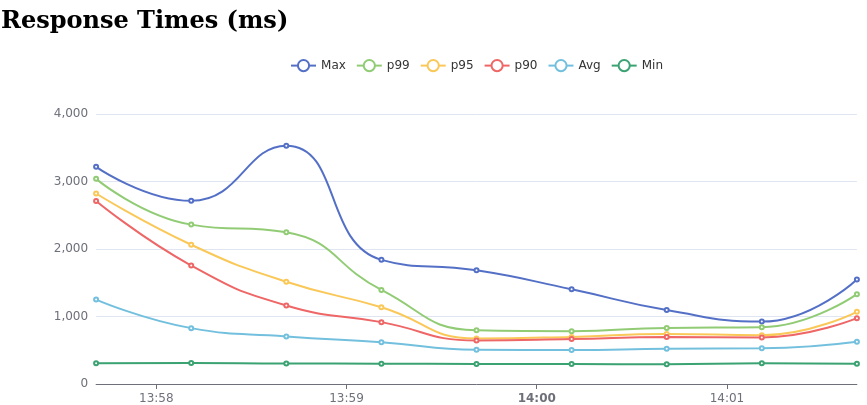
Figure 3. Global Latency Chart
|
Tulip Releases
Maven Central
<dependency>
   <groupId>io.github.wfouche.tulip</groupId>
   <artifactId>tulip-runtime</artifactId>
   <version>2.1.12</version>
</dependency>implementation("io.github.wfouche.tulip:tulip-runtime:2.1.12")///usr/bin/env jbang "$0" "$@" ; exit $\?
//DEPS io.github.wfouche.tulip:tulip-runtime:2.1.12
//JAVA 21
import io.github.wfouche.tulip.api.TulipApi;
public class App {
public static void main(String[] args) {
TulipApi.runTulip("benchmark_config.json");
}
}